Many industrial safety teams already have cameras, EHS software, and business intelligence tools. The problem is that these systems often operate apart from one another. Video stays in a security system, incidents live in an EHS platform, and trend analysis happens later in a dashboard. That separation slows response and makes it harder to see where risk is building.
A useful safety tech stack should help teams move from scattered records to a clear workflow. Cameras capture conditions on the floor, EHS software manages follow-up, and BI tools show trends across teams, shifts, and sites. When those pieces work together, leaders can spend less time searching for context and more time reducing exposure.
Define the Safety Questions Before Connecting Systems
Technology integration works best when it begins with practical safety questions. Start by naming the decisions your team needs to improve. Which areas have the highest repeat near misses? Which tasks create the most PPE gaps? Which shifts need more coaching? Which corrective actions reduced exposure after rollout?
Those questions help teams decide what data should move between systems. A camera event without a location, time stamp, event type, severity level, or action owner may create more review work than insight. A clean record gives supervisors enough information to respond and gives safety leaders enough structure to trend the event later.
This step also prevents overcollection. Not every camera feed needs to become part of the safety workflow at once. Begin with high-risk zones such as loading docks, forklift routes, pedestrian crossings, machine access points, or areas with repeat audit findings. A focused start gives EHS, operations, and IT a shared path for testing value before the stack expands.
Make Cameras a Source of Structured Safety Events
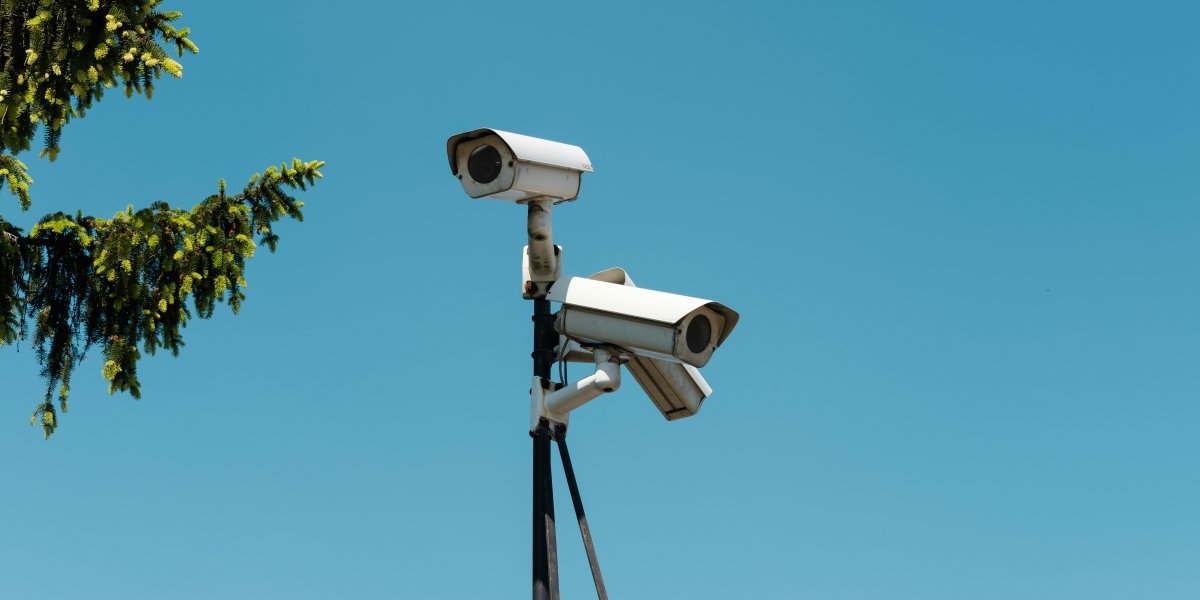
Cameras are often treated as passive recorders. They help after an incident, but they rarely shape daily prevention work unless someone spends time reviewing footage. A stronger approach is to turn camera views into structured safety events that can be reviewed, assigned, and measured.
That requires clear event definitions. For example, a vehicle and pedestrian interaction should include the zone, direction of travel, approximate proximity, time of day, and any related site rule. A PPE event should identify the area, task context, and required control. A restricted-area event should show the boundary and the access condition that was missed.
Visual evidence helps teams coach with specifics. Instead of telling a crew to be more careful around forklifts, a supervisor can show the exact crossing, explain the exposure, and reinforce the expected behavior. The discussion becomes grounded in real site conditions rather than broad reminders.
Use EHS Software to Manage the Response
Camera data becomes more valuable when it feeds a response process. EHS software should capture the event, connect it to the right category, assign ownership, track corrective action, and retain the record for audit review. This keeps the team from treating each visual observation as a one-off clip.
A good workflow should answer basic follow-up questions. Who reviewed the event? What action was taken? Was the action a coaching conversation, a route change, a barrier, a sign update, or a procedure change? Did the same event happen again after the action?
OSHA’s Recommended Practices for Safety and Health Programs encourage employers to find and fix hazards before workers are harmed.
That prevention mindset depends on follow-through. If observations are captured but not assigned, the stack will create awareness without closure. If actions are assigned but not checked against later trends, the team will struggle to know what worked.
Use BI Tools for Trends, Not Manual Investigation
Business intelligence tools are useful when the underlying safety data is consistent. They should not become a dumping ground for messy exports that require manual cleanup every week. The goal is to make trends easy to compare across time, location, event type, and site.
Good dashboards can help safety and operations leaders review exposure in a shared format. For example, a BI view might show that vehicle interaction events rise during a specific handoff window, or that one site closes corrective actions faster than another. These views help leaders focus resources where the data shows the greatest need.
- Use consistent event names across cameras and EHS records.
- Map every event to a site, zone, shift, and safety category.
- Track repeat events before and after corrective actions.
- Separate leading indicators from injury and incident outcomes.
- Review trends with both EHS and operations stakeholders.
Set Governance Before Data Starts Moving
Connected systems need clear governance. IT leaders need to know how video is processed, where data is stored, which systems receive event records, and who can access clips or reports. EHS leaders need a clear policy for how visual data supports coaching, investigation, and audit readiness.
Worker communication matters as well. Teams should understand what the program measures, why it exists, and how the information will be used. The safest approach is to keep the focus on hazardous conditions and repeat exposure, not constant personal monitoring. Access limits, retention rules, anonymization practices, and review procedures should be documented before rollout.
Governance also supports scale. A single site can operate with informal naming and local habits for a short period. A multi-site program cannot. Standard categories, location maps, and ownership rules make it easier to compare risk across facilities and expand the stack without rebuilding the workflow each time.
Build the Stack Around Action
A safety tech stack works when it helps people act sooner and learn faster. Cameras provide visual context. EHS software manages the response. BI tools show patterns and progress. The value comes from connecting those pieces into one practical flow from detection to follow-up.
For teams planning that structure, resources on building a connected EHS tech stack can help clarify how camera-based events, EHS records, privacy controls, and reporting tools can work together. The aim is simple: give safety and operations teams a clearer view of risk, a faster path to action, and better evidence that the action made a difference.